Justify Climate Goals. Explain Decisions.
Track, analyze, and reduce emissions with Evidence-backed Data, Audit Trails, and Public Reporting
Overview – Total emissions 457.88 tCO₂e (2026 • GHG Protocol)
Emissions Trajectory
Reduction scenarios to 2030
Yearly Comparison
Supply Chain
Engagement & data quality
Grade Distribution
Engagement Funnel
Scope Distribution
Built for teams that need to explain and defend their climate decisions
Answer the questions that matter most
Why did we choose these goals — and not others? Why invest in A but not B? Are we on track or just pretending?
Total Emissions
4,230 tCO₂e
Buildings & Energy
1,420 tCO₂e · 34% of total
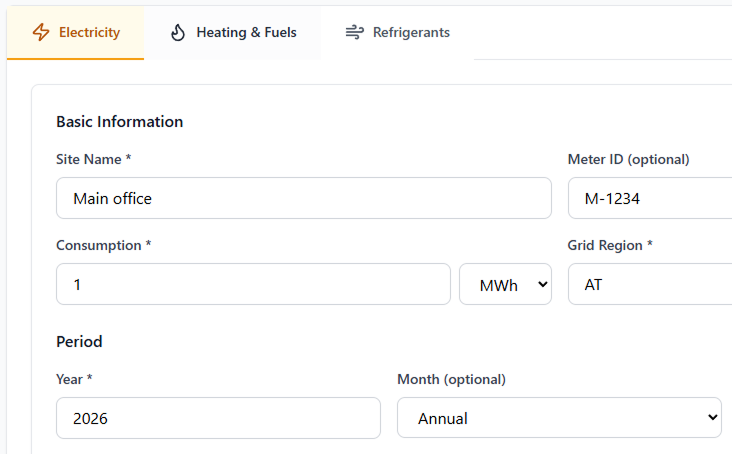
Consumption
42,150 kWh
Period
Jan – Dec 2024
Site
Vienna HQ
Audit Trail
Evidence uploaded
M. Schmidt · 2 hours ago
Value updated
K. Müller · 1 day ago
Record created
A. Weber · 3 days ago
Data Quality
87%
DEFRA 2025
LatestUK & International · 2,847 factors
UBA Austria
Austria · 312 factors
IEA Electricity
EU Grid Factors · 189 factors
Calculation Trace
Source: AT grid factor 2024 · v2.1
Factor Version
v2.1 · Updated Jan 2025
Turn carbon data into actionable climate strategy
Identify emission hotspots, track reduction progress, and report transparently — before stakeholders ask.
Enter Data with Evidence
Every data point links to invoices, meter readings, or supplier docs. Build trust through traceable records.
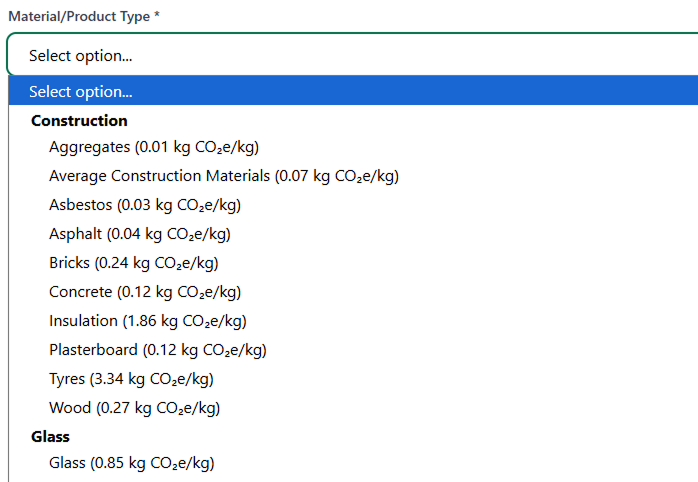
Access verified emission factors from trusted sources
Track supplier emissions across your value chain
Request data from suppliers, track responses, and progressively improve your Scope 3 accuracy.
Plan Reduction Actions & Publish Progress
Model action impacts, see projected savings, and embed a live climate widget on your website.
A public climate page residents can trust.
Show your community real progress — with methodology, coverage badges, and quarterly updates that build confidence, not confusion.
Climate Progress Dashboard
Last updated: Q2 2025
Community Total
Reduction Pathway to 2030
scoped publishes context: boundaries, coverage, and methodology — so residents don't misread the numbers.
Embed on your website:
<iframe src="https://scoped.earth/public/your-city" width="100%" height="480"></iframe>Emission factors you can audit.
Transparent factor sources, versioning, and overrides — so your methodology is explainable.
Powerful features. Easy to pick up.
Guided onboarding
Choose public administration or company. We tailor the workflow.
Public Transparency Widget
Embed progress on your municipal website in minutes.
Reduction Pathway
Turn actions into a credible, trackable trajectory.
Audit trail
Every edit is logged with who/what/when.
Quality scoring
See evidence coverage and completeness instantly.
Exports that stakeholders accept
PDF, JSON, and XBRL/iXBRL-ready reporting paths.
Make decisions explainable.
scoped helps municipalities and companies justify climate goals with evidence-backed data and transparent reasoning.
Get Started1,247 tCO2e
12% reduction vs. 2024
Data Quality Score